The company now sees sales down 1.5% sequentially; previous guidance was for 1%-6% sequential growth. The company also said it now sees non-GAAP EPS of 53-55 cents a share, below previous guidance of 58-62 cents.
“Our net sales activity in the June quarter did not progress as we originally expected,” CEO Steve Sanghi said in a statement. “We are seeing broad-based weakness in our business due to a number of factors. In the June quarter, our automotive business was down significantly from the March 2011 quarter due to lower automotive production activities including supply issues from other manufacturers associated with the earthquake in Japan. We also believe that some of the revenue upside that we saw in the March 2011 quarter was the result of customers being cautious and accelerating purchasing activities to minimize supply chain disruptions. Therefore, we believe we were also impacted by the correction of that inventory in the June 2011 quarter. Additionally, our consumer business was soft due to poorer global economic conditions including high unemployment, high oil prices and the resulting low consumer confidence. The computing portion of our business was also lower than our expectations as we saw reduced purchases by multiple large customers in this sector.” Forbes
Tuesday, July 12, 2011
Friday, July 8, 2011
Monday, July 4, 2011
Monday, June 27, 2011
Friday, June 24, 2011
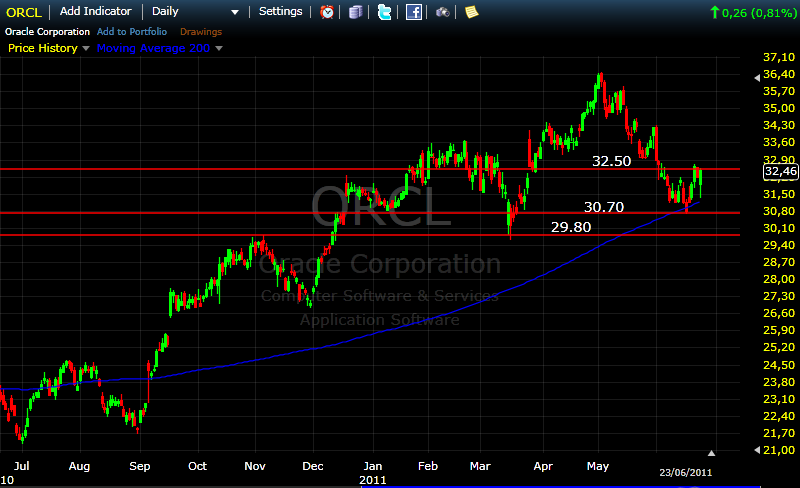
$ORCL Reasonable Results. Trading Levels.
"Oracle brought in total revenue of $10.8 billion, a hike of 12% on the same period last year, and a shade above analysts' estimates of $10.75 billion.
Excluding items, the database giant earned 75 cents a share, up from 60 cents a share in the prior year's quarter. Analysts surveyed by Thomson Reuters were looking for earnings of 71 cents a share."
Street.com
Very reasonable results IMO. 13 p/e on forward 1 year estimates os $2.40 gives $31.20 .
Excluding items, the database giant earned 75 cents a share, up from 60 cents a share in the prior year's quarter. Analysts surveyed by Thomson Reuters were looking for earnings of 71 cents a share."
Street.com
Very reasonable results IMO. 13 p/e on forward 1 year estimates os $2.40 gives $31.20 .
Thursday, June 23, 2011
$BBBY Will Re-Test Highs?
"Revenue at stores open at least a year rose 7 percent. That's an important retail measurement because it excludes the effects of stores that open or close during the year.
The company reported net income of $180.6 million, or 72 cents per share, for the quarter, compared with $137.6 million, or 52 cents per share, in the same quarter last year. Revenue rose nearly 10 percent to $2.11 billion.
The results beat analyst expectations of 62 cents per share on revenue of $2.07 billion, according to FactSet.
Bed Bath & Beyond said it now expects to earn 77 to 82 cents per share for the second quarter. Analysts had expected 82 cents per share.
In raising its full-year forecast, Bed Bath & Beyond said it expects earnings to rise 15 percent to 20 percent from last year. In April, the company said it expected a 10 percent to 15 percent increase." AP
Good results; 15P/E for a 10% sales grower seems reasonable which gives something in the area of $55.00 to 57.00 . (No debt...full of cash).
The company reported net income of $180.6 million, or 72 cents per share, for the quarter, compared with $137.6 million, or 52 cents per share, in the same quarter last year. Revenue rose nearly 10 percent to $2.11 billion.
The results beat analyst expectations of 62 cents per share on revenue of $2.07 billion, according to FactSet.
Bed Bath & Beyond said it now expects to earn 77 to 82 cents per share for the second quarter. Analysts had expected 82 cents per share.
In raising its full-year forecast, Bed Bath & Beyond said it expects earnings to rise 15 percent to 20 percent from last year. In April, the company said it expected a 10 percent to 15 percent increase." AP
Good results; 15P/E for a 10% sales grower seems reasonable which gives something in the area of $55.00 to 57.00 . (No debt...full of cash).
$ADBE Overreaction? Second Day Levels.
"Profit excluding certain costs in the second quarter, which ended June 3, rose to 55 cents a share, Adobe said in a statement yesterday. That compared with the 51-cent average analyst projection in a Bloomberg survey. Revenue increased 8.5 percent from a year earlier to $1.02 billion, topping analysts’estimates for $995.7 million.
In the current quarter, profit before some expenses will be 50 cents to 56 cents a share, Adobe said. That compares with a 54-cent average analyst prediction. Revenue will be $1 billion to $1.05 billion, the company said, while analysts had estimated $1.02 billion" BLOOMBERG
IMHO seems to me there was some overreaction
$KMX Second Day Levels.
"...posted net income of $126.3 million, or 55 cents per share for the three months ended May 31. That's up from $101.1 million, or 44 cents per share, a year ago. Earnings included a 3 cents per share gain related to its financing arm.Revenue rose 18 percent to $2.68 billion on strong used car sales and higher prices. Sales at stores open at least one year increased 6 percent.
Analysts surveyed by FactSet forecast adjusted earnings of 47 cents per share on $2.52 billion in revenue"
Monday, June 13, 2011
Adam H. Grimes Seminar on Entry Techniques. $study
Very interesting seminar. This is about one hour long , but took me about two hours or more to listen since its very rich in interesting trading statistics/observations that I had to keep stopping/rewinding so as to write down salient points such as:
- Only 4 types of trades exist really. (5 minutes 30 seconds)
- Difference of and proper use of "TippingPoint" and "Scaling In" entries. (10 minutes 20 seconds)
- Clarification/consistency of your time-frame. (19 minutes 30 seconds)
- Relation between the open and the day´s range. ( 34th minute )
Note that he is a swing trader, not an intra-day trader...trades based on daily bars...but honestly a lot if not all that he says can be "brought down" to a lower time frame.
- Only 4 types of trades exist really. (5 minutes 30 seconds)
- Difference of and proper use of "TippingPoint" and "Scaling In" entries. (10 minutes 20 seconds)
- Clarification/consistency of your time-frame. (19 minutes 30 seconds)
- Relation between the open and the day´s range. ( 34th minute )
Note that he is a swing trader, not an intra-day trader...trades based on daily bars...but honestly a lot if not all that he says can be "brought down" to a lower time frame.
Wednesday, May 11, 2011
Darth Vader, Peter Sellers and Stop Losses. $study
Stop losses are so important. Not using them makes you look like Peter sellers in this scene I´ve blogged about before...you just stare as the position moves against you.
http://jpotrading.blogspot.com/2010/09/link-between-not-using-stop-losses-and.html
I encountered another scene pertinent to the issue of using stop losses....how often have you told yourself "I will never again overide or not use them" but end up doing so....again? Just like Darth Vader keeps puting his foot in the oven in the following video...
http://jpotrading.blogspot.com/2010/09/link-between-not-using-stop-losses-and.html
I encountered another scene pertinent to the issue of using stop losses....how often have you told yourself "I will never again overide or not use them" but end up doing so....again? Just like Darth Vader keeps puting his foot in the oven in the following video...
Tuesday, May 10, 2011
On Shorting Relative Strength. $WTW $SYY $study
-I am often tempted to short stocks showing relative strength. This can be dangerous and goes against perceived "trading wisdom" . In fact I have blogged before about the importance of relative strength :
http://jpotrading.blogspot.com/search/label/relative%20strength
-If I do this I must first wait for relative weakness to manifest itself by, for example, a red 5 minute candle bar that takes out two or three of the previous five minute bars. The exact point of where you go short will depend on the stock, the general market strength, etc, but a valid short is now possible. I show this in the two charts below for $SYY and $WTW .
- The most important thing now is to input your stop-loss order somewhere close to the previous high as shown in the two charts. If you do not do this "horrible" things can happen....imagine not putting the stops in the chart below for $WTW .
http://jpotrading.blogspot.com/search/label/relative%20strength
-If I do this I must first wait for relative weakness to manifest itself by, for example, a red 5 minute candle bar that takes out two or three of the previous five minute bars. The exact point of where you go short will depend on the stock, the general market strength, etc, but a valid short is now possible. I show this in the two charts below for $SYY and $WTW .
- The most important thing now is to input your stop-loss order somewhere close to the previous high as shown in the two charts. If you do not do this "horrible" things can happen....imagine not putting the stops in the chart below for $WTW .
Saturday, May 7, 2011
$THOR Strong. Will it break 33.65?
-I identified 33.65 as important resisntance back on april 18th. http://jpotrading.blogspot.com/2011/04/thor-moving-pre-market-levels.html
It closed on friday at 33.58 (up about 5 %)...will keep an eye for a break of the level.
$WTW 71.50 Key Pivot
http://www.fool.com/investing/general/2011/05/06/weight-watchers-shares-plunged-what-you-need-to-kn.aspx
-Plan to trade long above 71.50 , short below.
Friday, May 6, 2011
Using Volume Spikes in Intraday Trading. $SLV $FXE $BBBY $CL $study
-If you are looking for a change in the intraday trend of an asset, volume spikes can be very helpful. I blogged in the recent past about an intraday spike in $BBBY and $CL . I blogged about both wondering if a turn would happen after I saw what seemed like a spike and in both cases the theory was correct...both stocks turned direction with the volume spike coinciding with the highs for the day.
- http://jpotrading.blogspot.com/2011/04/bbby-surge-in-volume-indicating-turn.html
- http://jpotrading.blogspot.com/2011/04/cl-8500-high-for-day.html
-Yesterday silver was collapsing and coincidentally the dollar was very strong. People were wondering if there was a cause and effect and if so in what direction; so I watched $FXE while wondering when/if $SLV would turn.
-The 11.00 volume bar in $FXE shows a spike in volume and the dollar stops stregthening.
-The 11.10 volume bar makes a huge volume spike (turns out biggest of the day).
This gave me confidence to make a long scalp in silver...the thought of something more substantial occured to me but $FXE and $SLV were just not bouncing with the energy needed.
- http://jpotrading.blogspot.com/2011/04/bbby-surge-in-volume-indicating-turn.html
- http://jpotrading.blogspot.com/2011/04/cl-8500-high-for-day.html
-Yesterday silver was collapsing and coincidentally the dollar was very strong. People were wondering if there was a cause and effect and if so in what direction; so I watched $FXE while wondering when/if $SLV would turn.
-The 11.00 volume bar in $FXE shows a spike in volume and the dollar stops stregthening.
-The 11.10 volume bar makes a huge volume spike (turns out biggest of the day).
This gave me confidence to make a long scalp in silver...the thought of something more substantial occured to me but $FXE and $SLV were just not bouncing with the energy needed.
Subscribe to:
Posts (Atom)